Introduction to Venn Diagrams
Venn diagrams are a visual representation of sets and their relationships. They were invented by John Venn in the 19th century and have since become a popular tool in various fields, including mathematics, logic, and statistics.
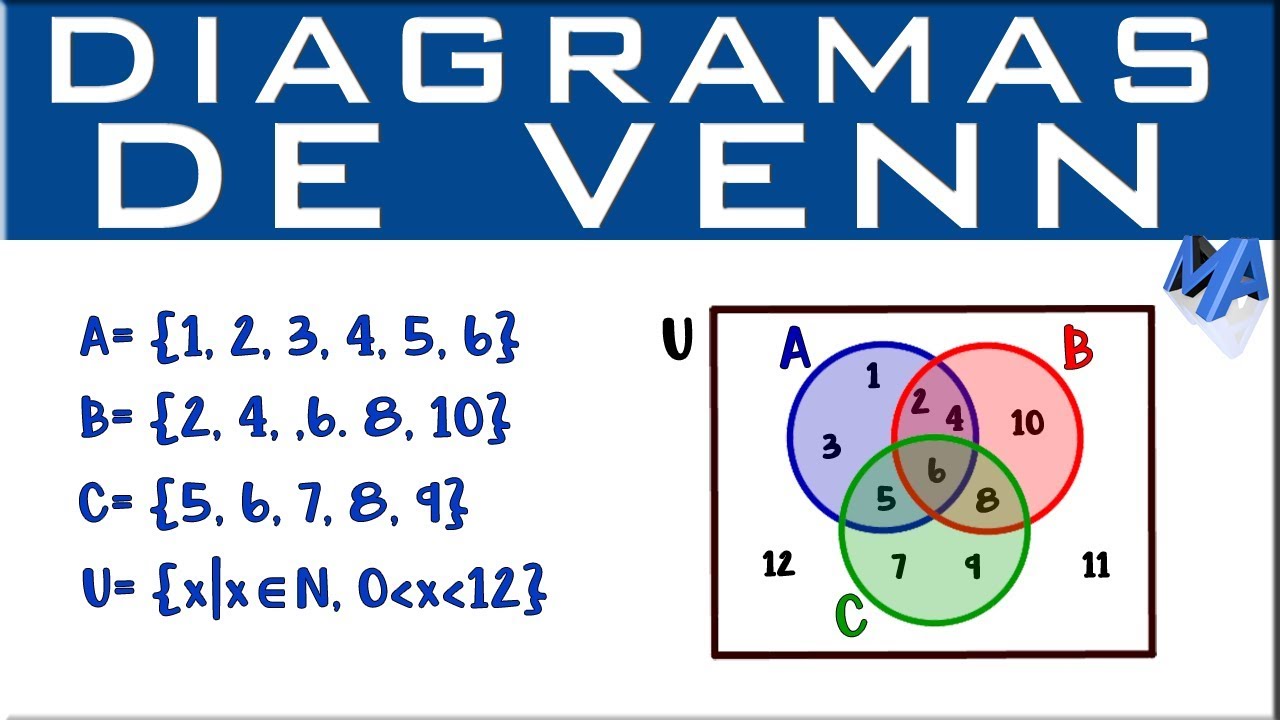
A Venn diagram consists of overlapping circles or ellipses, each representing a set or a category. The area where the circles overlap represents the elements or objects that are common to both sets. The non-overlapping areas represent the elements or objects that are unique to each set.
Venn diagrams can be used to illustrate logical relationships between sets. They can help us understand concepts such as intersection, union, complement, and difference between sets. For example, if we have two sets A and B, the intersection of A and B represents the elements that are common to both sets. The union of A and B represents all the elements that are in either set A or set B.
Venn diagrams are also useful for organizing and analyzing data. They can be used to classify objects or data points based on their attributes or characteristics. For instance, in a market research study, a Venn diagram can be used to categorize customers based on their preferences for different products or services.
In addition to two-set Venn diagrams, there are also three-set and four-set Venn diagrams that can be used to visualize more complex relationships between sets. These diagrams can help us analyze situations where there are multiple overlapping categories or conditions.
Benefits of Venn Diagrams:
- Easy visualization: Venn diagrams provide a clear and visual way to represent relationships between sets.
- Logical reasoning: Venn diagrams can help us apply logical reasoning to analyze and solve problems related to sets.
- Data organization: Venn diagrams are useful for organizing and categorizing data based on different criteria.
- Effective communication: Venn diagrams can simplify complex concepts and facilitate effective communication of ideas.
In conclusion, Venn diagrams are a powerful tool for representing sets and their relationships. They can be used in various fields to analyze data, solve problems, and communicate ideas. Understanding how to interpret and create Venn diagrams can enhance our logical reasoning and data analysis skills.
Using Figures as Elements
Figures are commonly used elements in HTML to display images, illustrations, diagrams, or any other content that needs to be visually represented. The <figure> tag is used to encapsulate these visual elements, while the <figcaption> tag is used to provide a caption or description for the figure.
Figures play an important role in enhancing the visual experience of a web page. By using appropriate markup, we can provide context and accessibility to our figures, making them more meaningful to both human users and assistive technologies.
Why Use Figures?
Using figures as HTML elements brings several benefits:
- Structured Information: Figures provide a consistent and structured way to organize visual content on a webpage.
- Accessibility: By using the <figcaption> tag, we can provide text alternatives for visual content, making it accessible to users with disabilities who may use screen readers or other assistive technologies.
- Styling and Layout: Figures can be easily styled and positioned using CSS, allowing for creative and visually appealing designs.
Using the Figure Element
To use the <figure> element, we wrap the visual content we want to represent in it. For example, to display an image of a beach:

In the above example, the <img> tag represents the visual content (the image), while the <figcaption> tag provides a caption or description for the figure.
In addition to the <figcaption> tag, we can also include other elements within the <figure> tag, such as headings, paragraphs, or even nested figures.
Conclusion
Using figures as HTML elements allows us to present visual content in a structured, accessible, and visually appealing way. By providing text alternatives and appropriate markup, we can ensure that our figures are meaningful and inclusive.
Analyzing Overlapping Figures
When working with figures in HTML, it’s not uncommon to encounter situations where multiple elements overlap each other. This can happen when using absolute positioning, floating elements, or even through the natural flow of the document.
When dealing with overlapping figures, it’s important to analyze the HTML structure and CSS properties involved. By properly understanding and manipulating these elements, we can achieve the desired visual outcome.
HTML Structure
One key aspect to consider is the order in which the overlapping figures appear in the HTML structure. The order determines which element will be displayed on top of the others. By rearranging the order or using CSS properties, such as z-index, we can control the stacking order and ensure the desired figure is displayed in front.
Positioning and Floats
Positioning and floats can also affect how the figures overlap. When using absolute positioning, elements are taken out of the natural document flow, allowing for precise control over their placement. Floating elements, on the other hand, can cause figures to sit next to each other, potentially resulting in overlapping. By adjusting the positioning or float properties, we can prevent or manage the overlapping effect.
Margins and Padding
Margins and padding play a crucial role in determining the space between figures and can indirectly affect their overlap. By adjusting these properties, we can create space between elements, reducing the chances of overlap, or even pushing figures away from each other.
Z-index
The z-index property is a powerful tool for layering elements on top of each other. By assigning different z-index values, we can control the stacking order and determine which figure appears in front. However, it’s essential to use this property judiciously and avoid excessive layering, as it may lead to unexpected results.
Conclusion
When faced with overlapping figures in HTML, it’s crucial to analyze the HTML structure, positioning, floats, margins, and padding. By understanding and manipulating these aspects, we can control the visual outcome and ensure the desired figures are displayed correctly.
Practical Examples
In this section, we will provide practical examples that demonstrate the use of HTML tags to enhance the appearance and functionality of web content.
Example 1: Creating a Heading
To create a heading in HTML, you can use the <h1> to <h6> tags. These tags represent different levels of headings, with <h1> being the highest level and <h6> being the lowest level.
Example 2: Creating Lists
List structures can be created in HTML using the <ul> (unordered list) and <ol> (ordered list) tags. Within these tags, list items can be added using the <li> tags.
An example of an unordered list:
- Item 1
- Item 2
- Item 3
An example of an ordered list:
- First item
- Second item
- Third item
Example 3: Adding Emphasis
To add emphasis to specific words or phrases, you can use the <strong> tags or the <b> tags. Both of these tags make the enclosed text appear in bold.
Here is an example sentence with emphasis:
This sentence has a strong emphasis on certain words.
Additionally, you can use the <em> tags or the <i> tags for italicized text. These tags don’t necessarily represent emphasis, but rather a change in the style of the text.
Example sentence with italicized text:
This sentence includes some italicized text for emphasis.
By utilizing these examples, you can effectively leverage HTML tags to enhance the structure, organization, and emphasis of your web content.
Conclusion
En resumen, podemos concluir lo siguiente:
- La tecnología ha revolucionado la forma en que vivimos. Desde la invención de Internet hasta los avances en la inteligencia artificial, la tecnología ha cambiado radicalmente la forma en que trabajamos, nos comunicamos y nos entretenemos.
- La importancia de mantenerse actualizado. En un mundo en constante evolución, es fundamental estar al tanto de las últimas tendencias tecnológicas. Esto nos permite aprovechar al máximo las oportunidades que ofrece y mantenernos competitivos en el mercado laboral.
- Los beneficios y desafíos de la tecnología. Si bien la tecnología nos ha brindado numerosos beneficios, como la automatización de tareas y la mejora de la eficiencia, también ha planteado desafíos, como la dependencia excesiva y la falta de privacidad.
- La responsabilidad individual. Cada persona tiene la responsabilidad de utilizar la tecnología de manera ética y responsable. Esto implica respetar la privacidad de los demás, evitar el abuso de la tecnología y utilizarla como una herramienta para mejorar la sociedad en general.
En conclusión, la tecnología juega un papel fundamental en nuestras vidas y es crucial mantenernos actualizados y hacer un uso responsable de ella. Aprovechemos los beneficios que nos brinda, al tiempo que enfrentamos los desafíos que conlleva, para construir un futuro mejor para todos.