Step 1: Prepare your data
When it comes to working with data, the first step is to prepare it in a format that is suitable for analysis. This involves cleaning and structuring the data in a way that allows for efficient processing and meaningful insights.
To start the data preparation process, it is important to carefully assess the quality and completeness of the data. This includes checking for missing values, duplicate entries, and any inconsistencies or errors that may affect the analysis results.
Once the data quality has been assessed and addressed, the next step is to organize the data into a structured format. This can include creating tables or spreadsheets, defining variables and their types, and ensuring that the data is properly labeled and formatted.
Another important aspect of data preparation is data cleaning. This involves removing any outliers or anomalies in the data, correcting errors, and handling missing values. This process ensures that the data is reliable and accurate for analysis.
Additionally, it may be necessary to transform or manipulate the data to make it suitable for analysis. This could involve performing calculations, aggregating data, or creating new variables based on existing ones. These transformations help to derive meaningful insights and patterns from the data.
Lastly, it is important to ensure that the prepared data is properly documented. This includes documenting any assumptions made, the steps taken during data preparation, and any changes made to the original data. Proper documentation helps to ensure transparency and reproducibility in the analysis process.
In conclusion, preparing data is an essential step in any data analysis project. It involves carefully assessing the data quality, organizing and structuring the data, cleaning and transforming it, and documenting the entire process. By investing time and effort into data preparation, analysts can ensure the reliability and accuracy of their analysis results.
Step 2: Calculate the mean
Once you have collected the data you need, the next step is to calculate the mean. The mean, also known as the average, is a measure of central tendency that represents the typical value in a set of numbers.
To calculate the mean, you need to add up all the numbers in your data set and then divide the sum by the total number of values. Here are the steps to follow:
- Add up all the numbers: Start by adding up all the numbers in your data set. This will give you a total sum.
- Count the number of values: Determine how many values are in your data set. This will be the total number of observations or data points.
- Divide the sum by the count: Take the total sum and divide it by the count. The result is the mean.
For example, let’s say you have the following data set:
5, 8, 3, 9, 2
To calculate the mean, you would:
- Add up the numbers: 5 + 8 + 3 + 9 + 2 = 27
- Count the number of values: There are 5 values in this data set.
- Divide the sum by the count: 27 ÷ 5 = 5.4
Therefore, the mean of this data set is 5.4.
Calculating the mean is a fundamental step in many statistical analyses. It provides a representative value that can help summarize the data and make comparisons between different sets of numbers. Remember, though, that the mean can be sensitive to outliers, so it’s important to consider other measures of central tendency in conjunction with the mean.
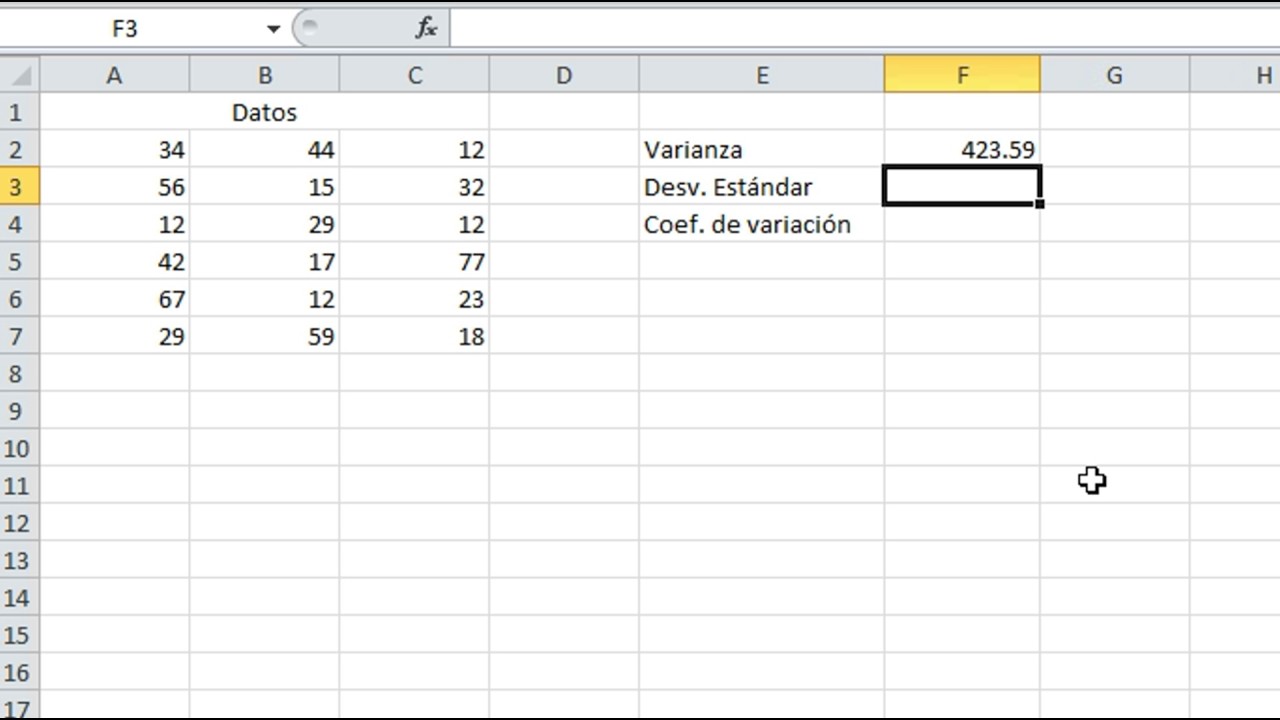
Step 3: Calculate the standard deviation
In statistics, the standard deviation measures the amount of variation or dispersion in a set of numbers. It tells us how tightly or loosely the data points are clustered around the mean. Calculating the standard deviation gives us a sense of how spread out the data is.
To calculate the standard deviation, we follow these steps:
- Find the mean of the data set. This is done by adding up all the values and dividing by the number of data points.
- Subtract the mean from each data point and square the result.
- Calculate the sum of all squared differences.
- Divide the sum by the number of data points minus one.
- Take the square root of the result to find the standard deviation.
Let’s go through an example to better understand how to calculate the standard deviation.
Example:
Suppose we have the following data set:
- 10
- 12
- 14
- 16
- 18
Step 1: Find the mean
Mean = (10 + 12 + 14 + 16 + 18) / 5 = 70 / 5 = 14
Step 2: Subtract the mean and square the result
- (10 – 14)^2 = 16
- (12 – 14)^2 = 4
- (14 – 14)^2 = 0
- (16 – 14)^2 = 4
- (18 – 14)^2 = 16
Step 3: Calculate the sum of squared differences
Sum = 16 + 4 + 0 + 4 + 16 = 40
Step 4: Divide the sum by the number of data points minus one
Divide by 5 – 1 = 4
Result = 40 / 4 = 10
Step 5: Take the square root
Standard Deviation = √10 ≈ 3.16
The standard deviation of this data set is approximately 3.16.
In conclusion, the standard deviation provides a measure of the spread of data around the mean. It is useful in analyzing the variability and distribution of a data set.
Step 4: Calculate the coefficient of variation
To calculate the coefficient of variation, follow these steps:
- Calculate the mean (average) of the data set.
- Calculate the standard deviation of the data set.
- Divide the standard deviation by the mean.
- Calculate the coefficient of variation using the formula:
Coefficient of Variation = (Standard Deviation / Mean) * 100
The coefficient of variation is a measure of relative variability. It is often used to compare the variability of different data sets, especially if the means of the data sets are different.
By calculating the coefficient of variation, you can determine which data set has a higher or lower variability relative to its mean. A lower coefficient of variation indicates that the data set has less variability, while a higher coefficient of variation indicates greater variability.
Calculating the coefficient of variation is useful in various fields, such as finance, statistics, and quality control. It provides insight into the dispersion of data and can aid in decision-making processes.
Step 5: Interpret the coefficient of variation
After calculating the coefficient of variation, it is important to interpret the result. The coefficient of variation is a statistical measure that shows the relative variability within a dataset.
What does the coefficient of variation tell us?
The coefficient of variation provides insight into the consistency or inconsistency of the data values. It is often used to compare the variability between different datasets or different samples from the same population.
The coefficient of variation formula:
CV = (Standard Deviation / Mean) × 100
Interpreting the coefficient of variation:
- If the coefficient of variation is low (less than 15%), it indicates a low relative variability and high consistency among the data values. This suggests that the dataset is relatively stable and reliable.
- If the coefficient of variation is moderate (15% to 30%), it implies a moderate relative variability and moderate consistency. The dataset shows some level of variation, but it is not considered highly unpredictable.
- If the coefficient of variation is high (greater than 30%), it indicates a high relative variability and low consistency. The dataset has a large amount of variation, suggesting that it may be unreliable or highly unpredictable.
Limitations of the coefficient of variation:
While the coefficient of variation is a useful measure for evaluating variability, it has some limitations. It is sensitive to outliers, meaning that extreme values can significantly impact the result. Additionally, the coefficient of variation alone cannot provide information about the underlying distribution of the data.
In conclusion, the coefficient of variation is a valuable tool for assessing the relative variability within a dataset. By interpreting its value, we can gain insights into the consistency and predictability of the data. However, it is important to consider its limitations and use it in conjunction with other statistical measures for a comprehensive analysis.